by American Council on Exercise
on February 22, 2021
Imagine a world where packaged foods and drinks do not contain consistent and uniform nutrition facts labels. Consider how challenging it would be to make healthy food choices regarding the quality and quantity of the foods you consume. This was the case before 1990, when the Food and Drug Administration (FDA) passed the Nutrition Labeling and Education Act (NLEA). Since then, several iterations of nutrition facts labels have taken form, and, by the mid-1990s, most food packaging contained the iconic black and white label that most people recognize.
However, if you are a keen observer, you may have recently noticed changes to the nutrition facts label on some of the foods you purchase. In 2016, significant updates to the label were initiated for the first time in more than 20 years and food manufacturers are working together with the FDA to ensure a complete update by July 1, 2021. The nutrition facts label is being updated based on new nutrition research, updated scientific information, and input from the public, all to make it easier for consumers to make informed food choices to better support a healthy diet. This is all part of the FDA’s ongoing public health efforts to reduce nutrition-related preventable death and disease and to help individuals maintain healthy dietary practices.
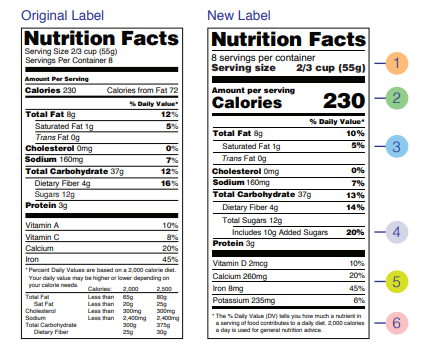
1. Serving Sizes Have Been Revised to Better Reflect the Amounts of Food and Drink People Typically Consume
They are not a recommendation for how much a person should consume. For example, the serving size for soda has changed from 8 ounces to 12 ounces not to encourage the consumption of more soda, but instead to better represent how much soda is typically consumed as a single serving. In addition, the declared serving size now appears in a larger and bolder font. If a food package contains an amount that is between one and two servings, such as a 15 ounce can of soup, it is required to be labeled as one serving because people typically consume the whole can.
2. The Most Noticeable Change to the Label Is the Larger and Bolder Font Used for Calories
This change makes this information easy to find, which can be very helpful when comparing foods in the store or when keeping track of calories consumed.
3. Because Research Suggests That the Type of Fat Consumed Is More Important Than the Amount of Fat Consumed, “Calories From Fat” Has Been Removed From the Label
- The daily nutritional goal for total fat is 20–35% of total calories.
- Daily saturated fat intake should be less than 10% of total calories.
4. Added Sugars Are Now Required to Appear on the Nutrition Facts Label as a Percent Daily Value and in Grams
This addition to the label aligns with a key focus from the 2020-2025 Dietary Guidelines for Americans for limiting foods and beverages higher in added sugars, with a recommendation to consume less than 10% of calories per day from added sugars. If you consume more than 10% of calories from added sugars, it is hard to meet nutrient needs while staying within calorie limits.
5. Underconsumption of Vitamin D and Potassium Is Considered a Public Health Concern for the General U.S. Population Because an Inadequate Intake Is Associated With Health Concerns
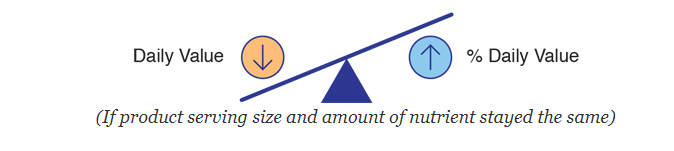
Luckily, ensuring an adequate amount will now be easier with the requirement that potassium and vitamin D appear on the label. Additionally, not only must a percent daily value be provided for vitamin D, potassium, calcium, and iron, but the actual amount must also be provided. Vitamins A and C are no longer required to appear on the label because deficiencies of these nutrients are rare. Also, it is important to note that new scientific evidence has led to higher and lower percent daily values for certain nutrients (Tables 1 and 2). For example, the percent daily value for total fat has increased from 65 grams to 78 grams, meaning that if a packaged food contains 40 grams of fat in one serving it would have previously been labeled as 62% of the daily value and now it would be labeled as 51% of the daily value. In addition, added sugars and choline now have percent daily values (Table 3). Figures 1 and 2 depict the relationship between daily value and percent daily value—as one increases, the other increases.
- 5% daily value or less of a nutrient per serving is considered low.
- 20% daily value or more of a nutrient per serving is considered high.
Table 1
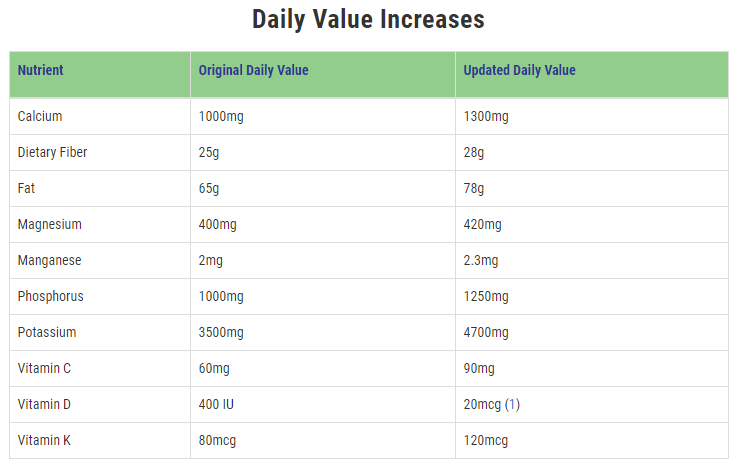
Table 2
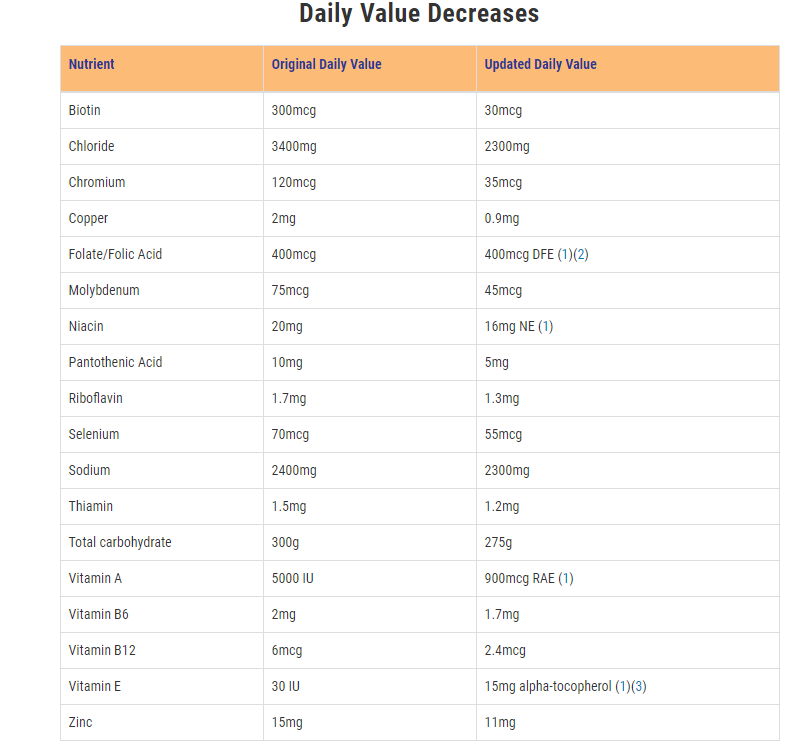
Table 3
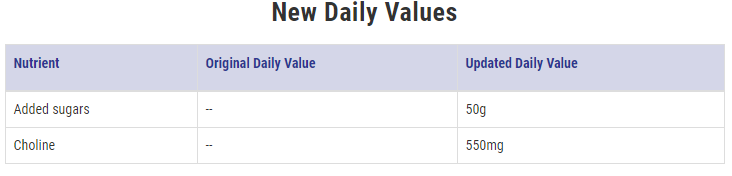
Figure 1
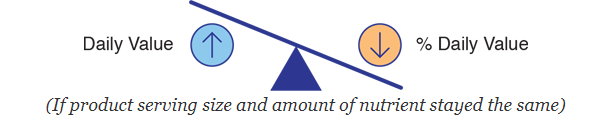
Figure 2
6. The Footnote at the Bottom of the Label Has Been Simplified to Better Explain the Meaning of Percent Daily Value
This helps individuals more clearly understand nutrition information in the context of total daily calories consumed.
Reading the nutrition facts label may seem like a daunting task, but it can help you make informed dietary decisions as part of a healthy eating pattern and avoid nutrition-related health concerns. To practically apply this information and better understand how the label relates to your daily food intake, please visit MyPlate.
